
digital humanities
Academic Digital Presence
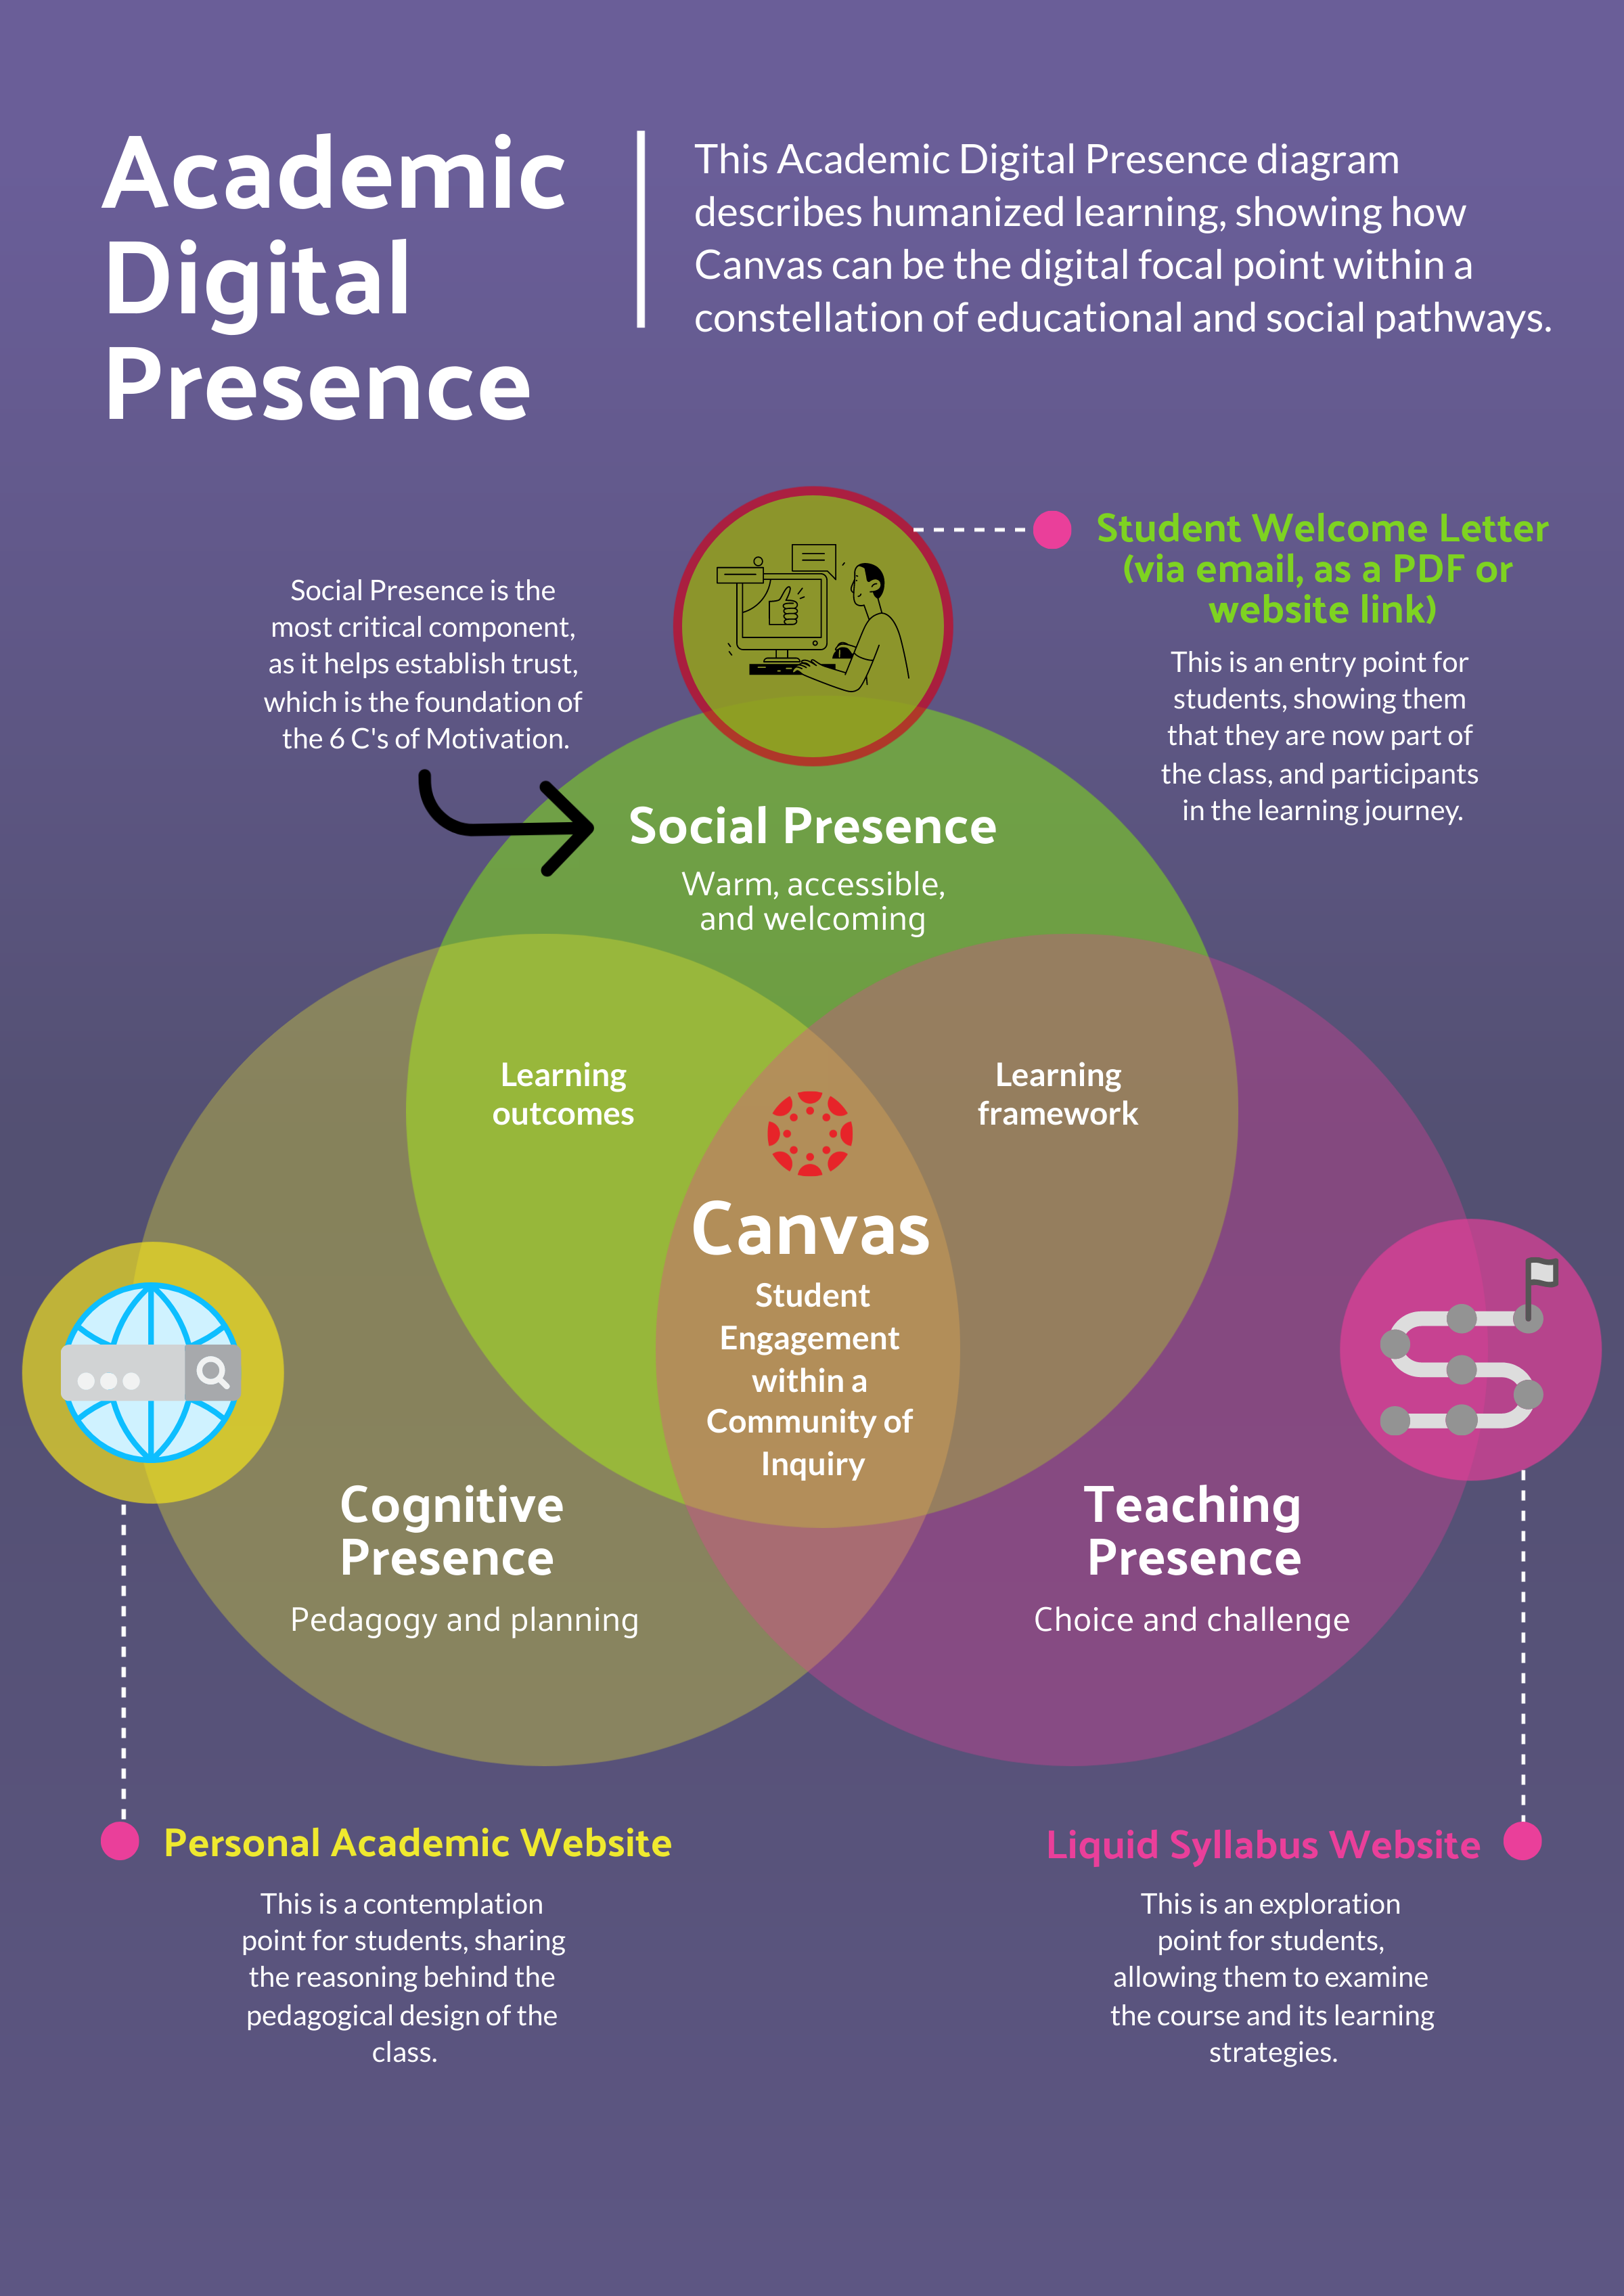
I created the infographic below for a Canvas certification course, “Humanizing Learning in Canvas.”
The course was part of the Canvas Certified Educator for Higher Education pathway.
Coyote Time and Empathetic Design
“Failure is a path, not an immediate result.”1
I was listening to ATP podcast, and John Siracusa discussed “Coyote Time.”
The idea of Coyote Time comes from Wile E. Coyote cartoons, and it’s rooted in video game design.
In the Wile E. Coyote and the Road Runner cartoons, Wile E. Coyote tends to end up just off the edge of a cliff, but he doesn’t fall until he realizes his dire situation.
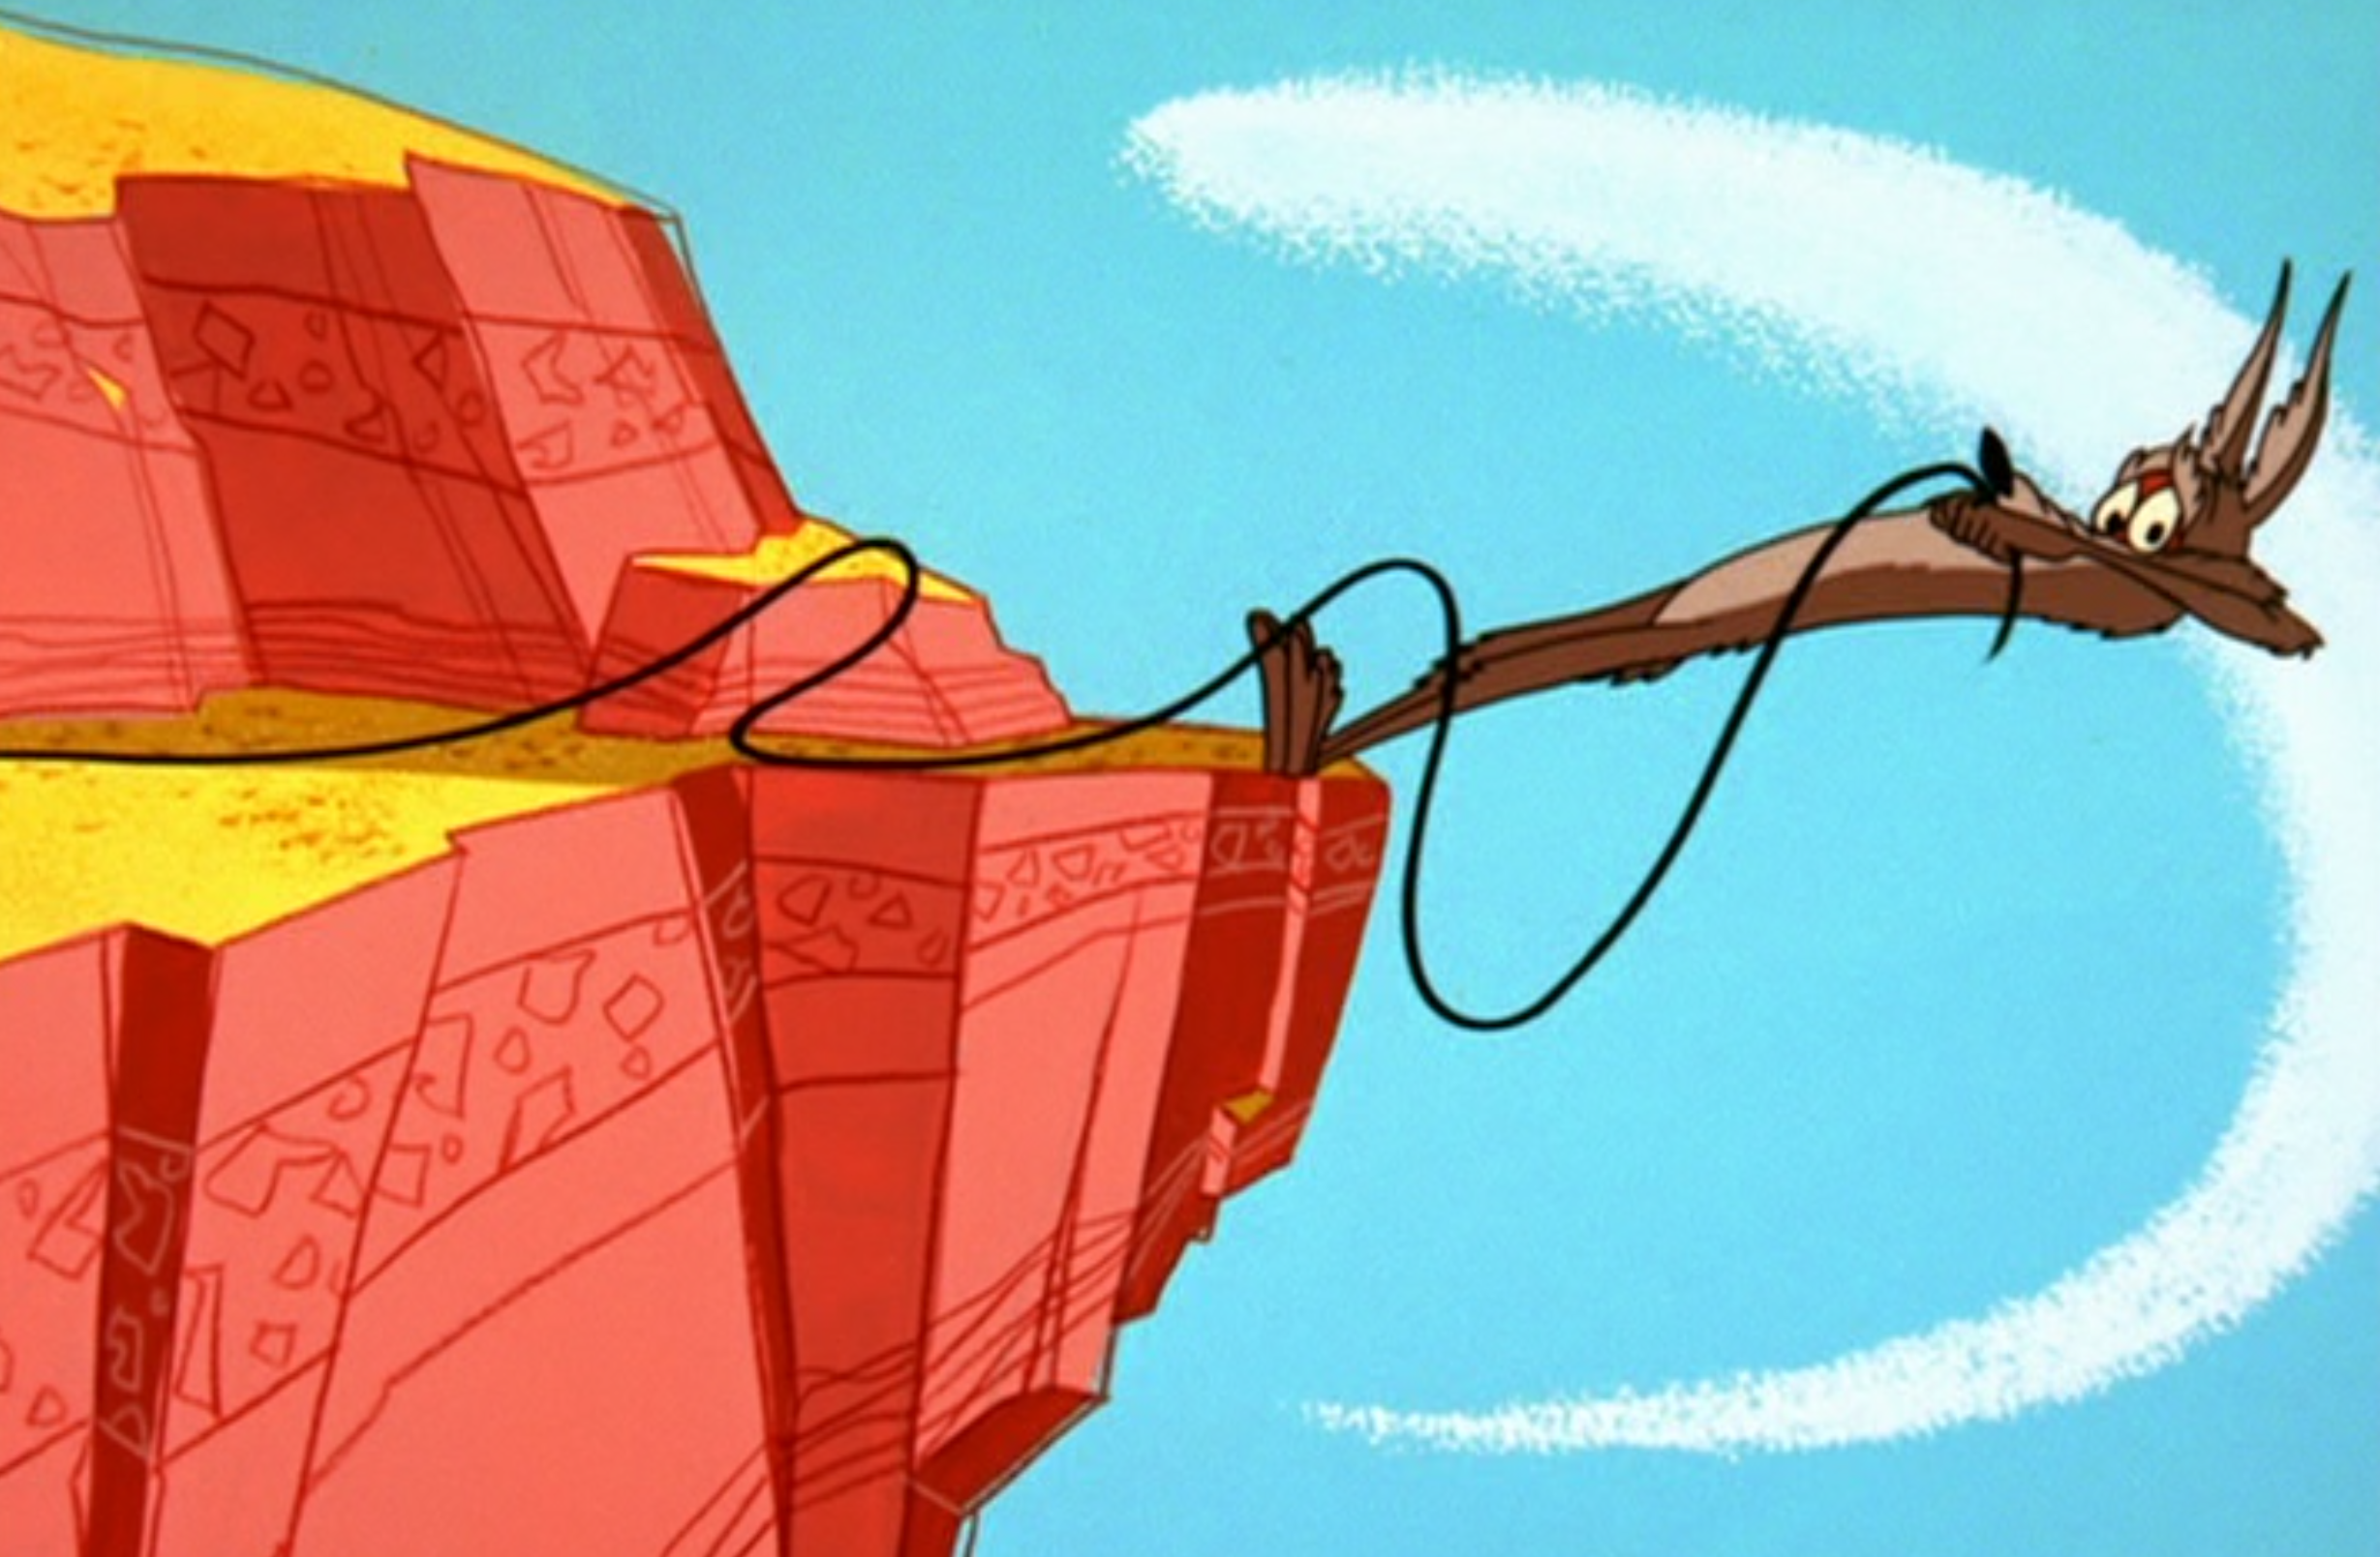
At a glance, it would appear that Coyote Time is a moment of realization, a sinking feeling of impending doom. However, in video game design, Coyote Time is more about forgiveness and empathetic design choices. Coyote Time is about designing features into a game that provide a sense of reality apart from the harsh mechanics of the game itself.
In, “Coyote Time: What Games can Teach Us About Forgiveness in Learning,” Eva Grouling Snider describes Coyote Time as providing “wiggle room” and reducing frustration, which helps to “minimize the consequences of errors, mistakes, and imperfections.”
In educational design and video game design, Coyote Time can be relied on for applying both reality and unreality, a sense of authenticity or inauthenticity, with the end goal of providing engaging experiences where the student, or player, is able to perform at their best.
For example, in video games, this is often a bit of lag introduced purposefully to enable the player to perform an action, such as jumping over a difficult object. In teaching, this could be a low-stakes formative assessment, or perhaps a quiz that can be taken multiple times but only saving the highest score. In lower division courses, Coyote Time may be increased, and then gradually designed out of the course for upper division or graduate level work.
In teaching, Coyote Time can be explicit, for example, allowing drafts to be submitted for comments prior to the formal essay. Coyote Time can also be implicit, in that it’s designed into the course and woven through the educational pathways, providing layers of support while not necessarily stating the design choices.
-
Eva Grouling Snider, “Coyote Time: What Games can Teach Us About Forgiveness in Learning,” The Teaching Innovation Blog, Ball State University, Muncie, Indiana, November 15, 2023. ↩︎
Visualizing History
Histography is a data visualization project by Martin Stauber, and it’s pretty amazing.
“Histography" is interactive timeline that spans across 14 billion years of history, from the Big Bang to 2015. The site draws historical events from Wikipedia and self-updates daily with new recorded events. The interface allows for users to view between decades to millions of years. The viewer can choose to watch a variety of events which have happened in a particular period or to target a specific event in time. For example you can look at the past century within the categories of war and inventions.
The project reminds me of The Fifth Element when Leeloo is researching “War." It’s not the interface, but the way so much information can be visualized in such a compact form – it can be a bit overwhelming.
(Revised and republished April 12th, 2025)
The Census Has Always Been "Big Data"
The Census has always been “Big Data,” with or without computers and the automation of information.
Census and Sensibility: A Little History of Big Data at IEEE (Wayback Machine link)
Consider just one use of today’s big data with a deep history and a major impact on computational technology: keeping track of a country’s citizenry. This has often been accomplished through a periodic counting, or census. Many references to censuses exist in the ancient world, from Egyptian tomb inscriptions and the Hebrew Bible to, perhaps, most famously, the “worldwide” Roman census described in the Book of Luke in the New Testament.
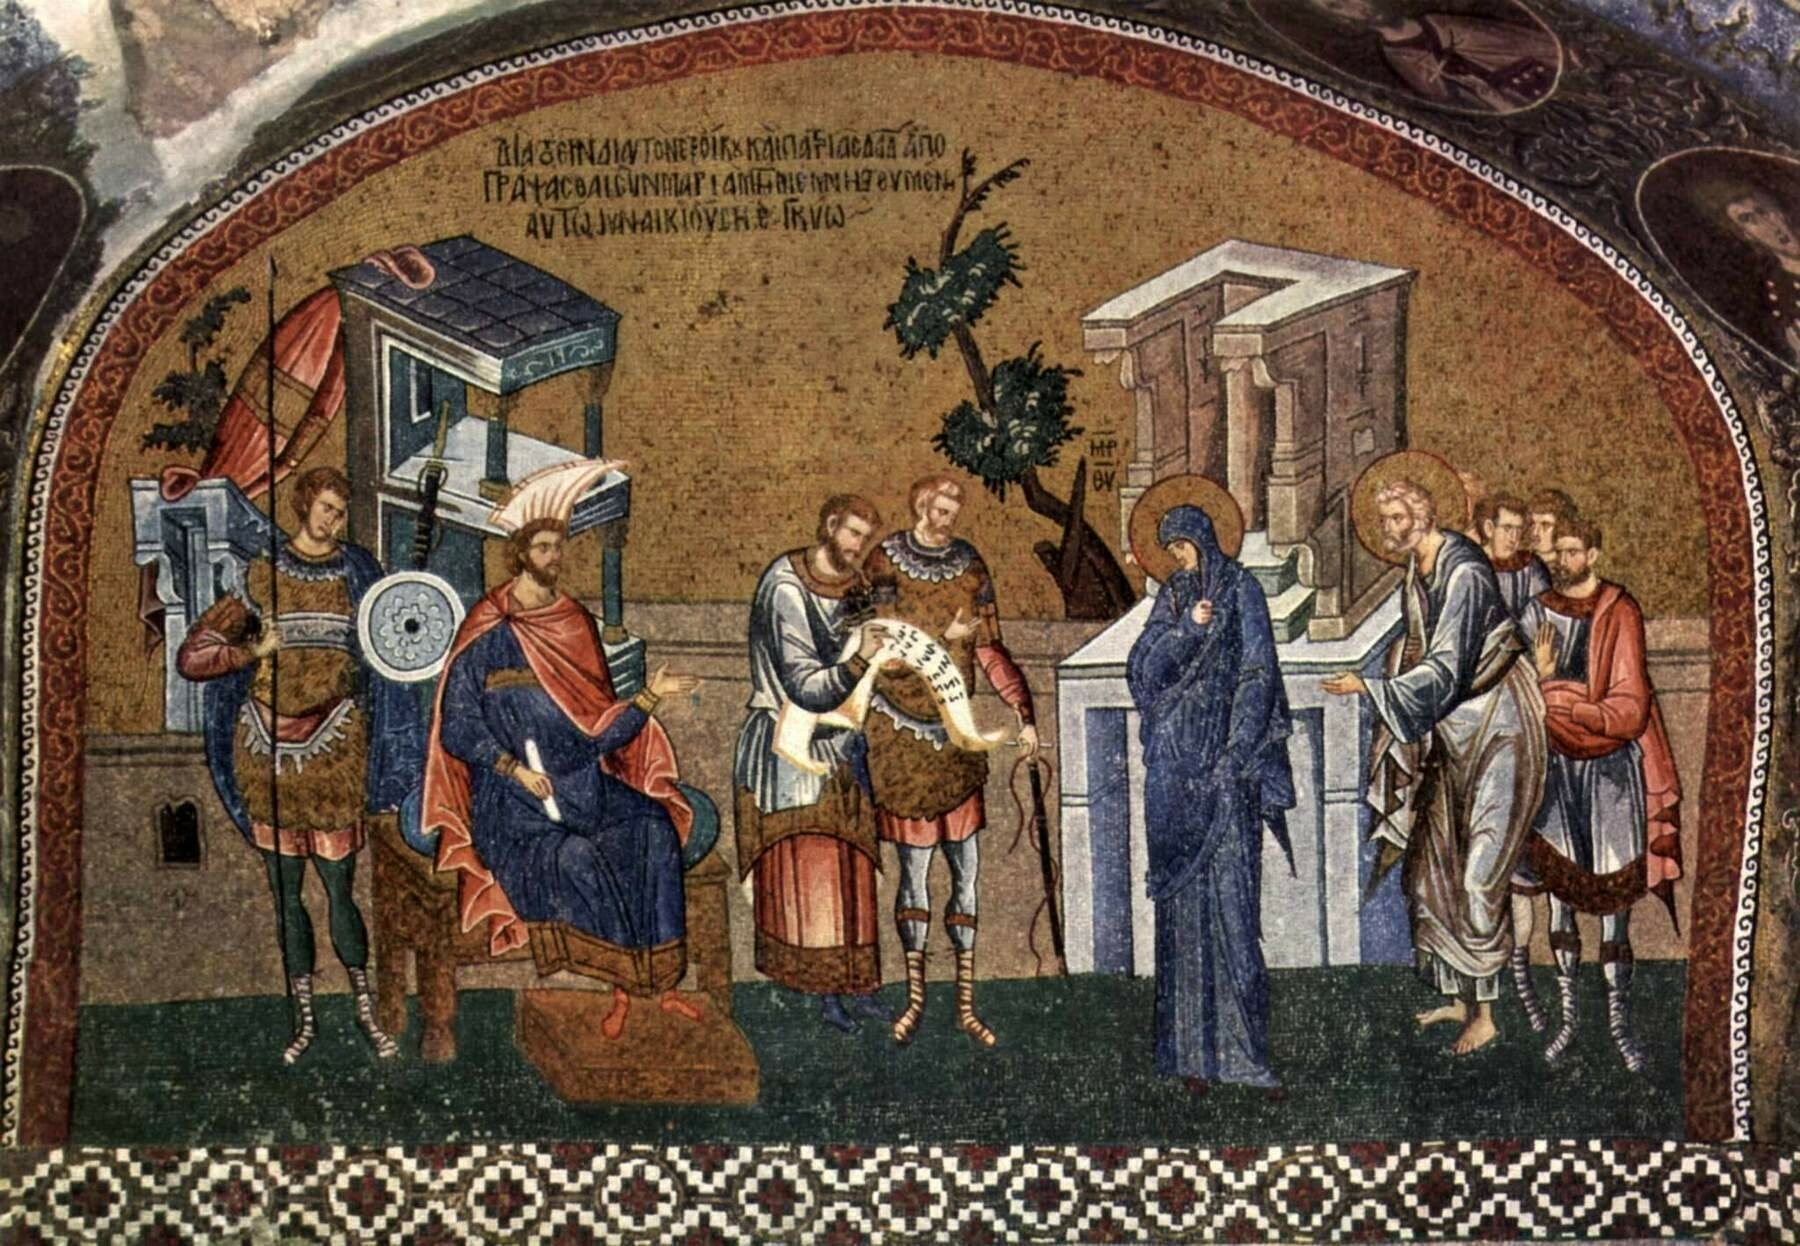
The Virgin and Saint Joseph register for the census before Governor Quirinius. Byzantine mosaic at the Chora Church, Constantinople 1315–1320 – via Wikipedia
(Revised and republished March 28th, 2025)
Digital Imaginaries at AoIR
Something tells me I should have applied to the Association of Internet Researchers annual conference this year – the theme is “Digital Imaginaries.” The CFP has already passed, but the conference itself is coming up in late October, 21–24th, in Phoenix, Arizona. http://aoir.org/ir16/
The 16th annual Internet Research conference will provide an opportunity to question the ways that networked technologies are imagined and enter into collective imaginaries. In what ways do we culturally apprehend and make sense of digital media? These imaginaries influence our actual and potential uses of technology, as well as how we constrain, encourage, and dream about those uses.

(Revised and republished March 29th, 2025)
I’ll See You Online: Teaching Assistants, Google Hangouts, and the Online Classroom
This paper was presented at the Cultural Studies Association annual conference in Riverside, CA in May of 2015.
When asked to be a teaching assistant for a fully online class at UC Riverside, my initial response was “of course…but what do I do?” The transition for teaching assistants into the digital world is an often overlooked aspect of online education, with little attention paid to issues of digital preparation, social media training, shifting labor demands, and digital pedagogy. In the physical classroom, teaching assistants play a vital role by grading papers, leading discussion sections, and most importantly, interacting with students. In the virtual classroom, however, TAs can easily become readers or aides that only grade papers and have little connection with students, or even the professor. In order to remedy this situation, in three online courses over the last two years in which I was a TA, the video conferencing service Google Hangouts was used for synchronous class discussions.
Sea Monsters and Submarine Cables
Vintage-style map of submarine cables by TeleGeography (Wayback Machine link).
This year’s map pays tribute to the pioneering mapmakers of the Age of Discovery, incorporating elements of medieval and renaissance cartography. In addition to serving as navigational aids, maps from this era were highly sought-after works of art, often adorned with fanciful illustrations of real and imagined dangers at sea. Such embellishments largely disappeared in the early 1600s, pushing modern map design into a purely functional direction.

To bring back the lost aesthetic that vanished along with these whimsical details, TeleGeography referenced a variety of resources in the design process. One of the most invaluable was Chet Van Duzer’s Sea Monsters in Medieval and Renaissance Maps book, which provides arguably the most complete history of the evolution of sea monsters and map design from this period. Our final product is a view of the global submarine cable network seen through the lens of a bygone era.
There's an interactive online version of the map as well:
http://submarine-cable-map-2015.telegeography.com
(via Vox)
(Revised and republished April 12th, 2025)
Teacher-Facilitators
The Deconstruction of the K-12 Teacher, by Michael Godsy at The Atlantic (2015):
There is a profound difference between a local expert teacher using the Internet and all its resources to supplement and improve his or her lessons, and a teacher facilitating the educational plans of massive organizations.
The article makes some interesting points, and it applies beyond K-12 also. The name of the article in the title bar is "When the Computer Takes Over for the Teacher," which seems a better fit for the story. It's also not just about computers, but a fundamental shift in the way information is created and shared.
(Revised and republished April 12th, 2025)
Digital Archaeology at The Deleted City
In an heroic effort to preserve 10 years of collaborative work by 35 million people [Geocities], the Archive Team made a backup of the site just before it shut down. The resulting 650 Gigabyte bit-torrent file is the digital Pompeii that is the subject of an interactive excavation that allows you to wander through an episode of recent online history.
(Revised and republished April 13th, 2025)
Fred Soper - Wikipedia
I happened across an historical US passport for Fred Soper (1893-1977), the American epidemiologist and public health administrator, while doing some research on paperwork. The National Library of Medicine has a page on Fred Soper under their "Profiles in Science" project, but Soper's Wikipedia page is quite lacking (updates have been made since 2015). Updating Wikipedia for this historical figure would make a great project for a History and/or Digital Humanities class. There's also a listing of primary visual sources, with high resolution images.
(Revised and republished April 13th, 2025)